Phecode color scale for ggplot2
scale_color_phecode()
Value
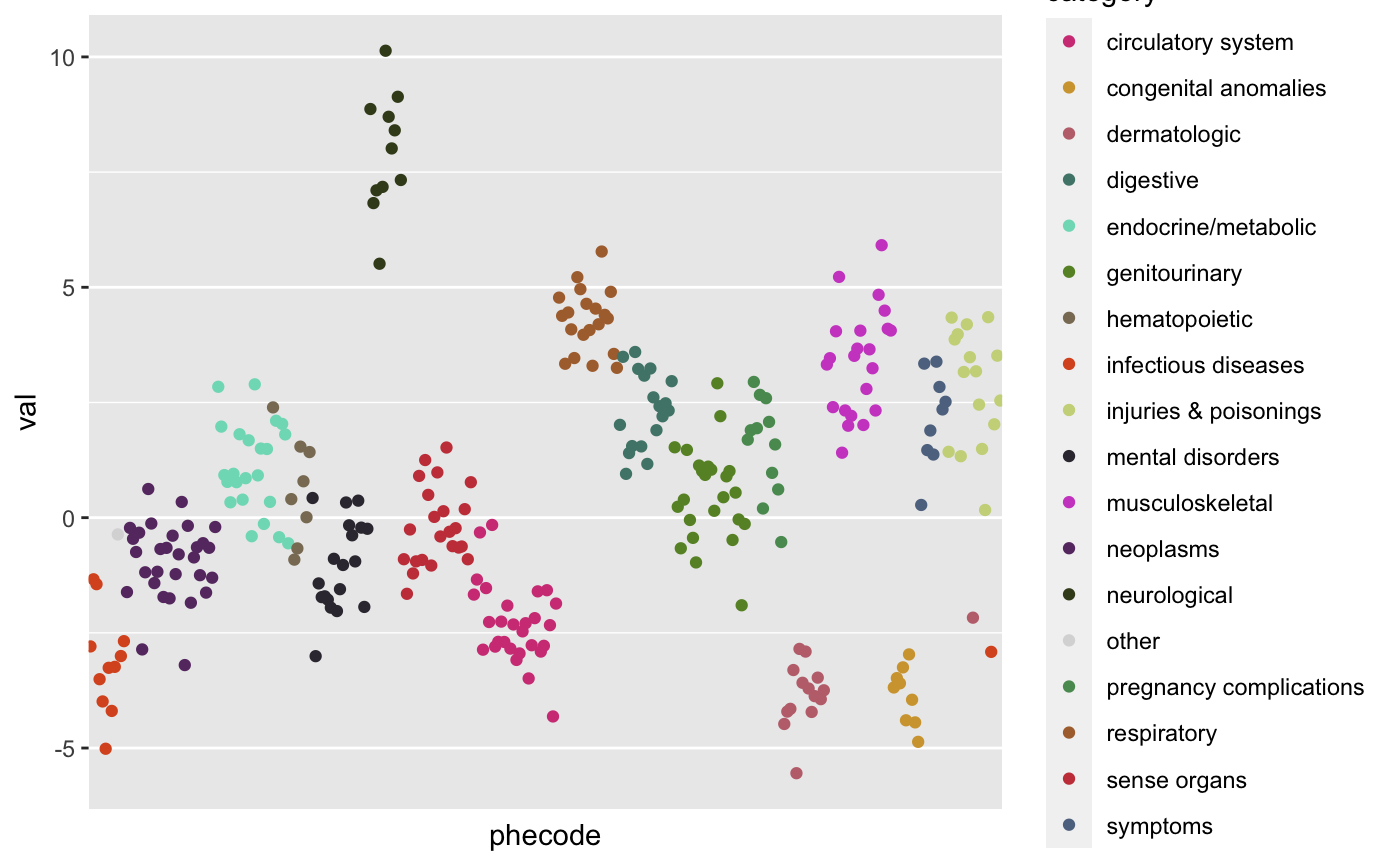
ggplot2 color scale using category_colors() colors for each category.
Examples
library(dplyr)
library(ggplot2)

sample_n(phecode_descriptions, 300) %>%
  left_join(category_colors(return_df = TRUE) %>%
              mutate(bias = rnorm(n(), sd = 3)),
            by = 'category') %>%
  mutate(val = rnorm(n(), mean = bias)) %>%
  ggplot(aes(x = phecode, y = val, color = category)) +
  geom_point() +
  scale_color_phecode() +
  theme_phewas()