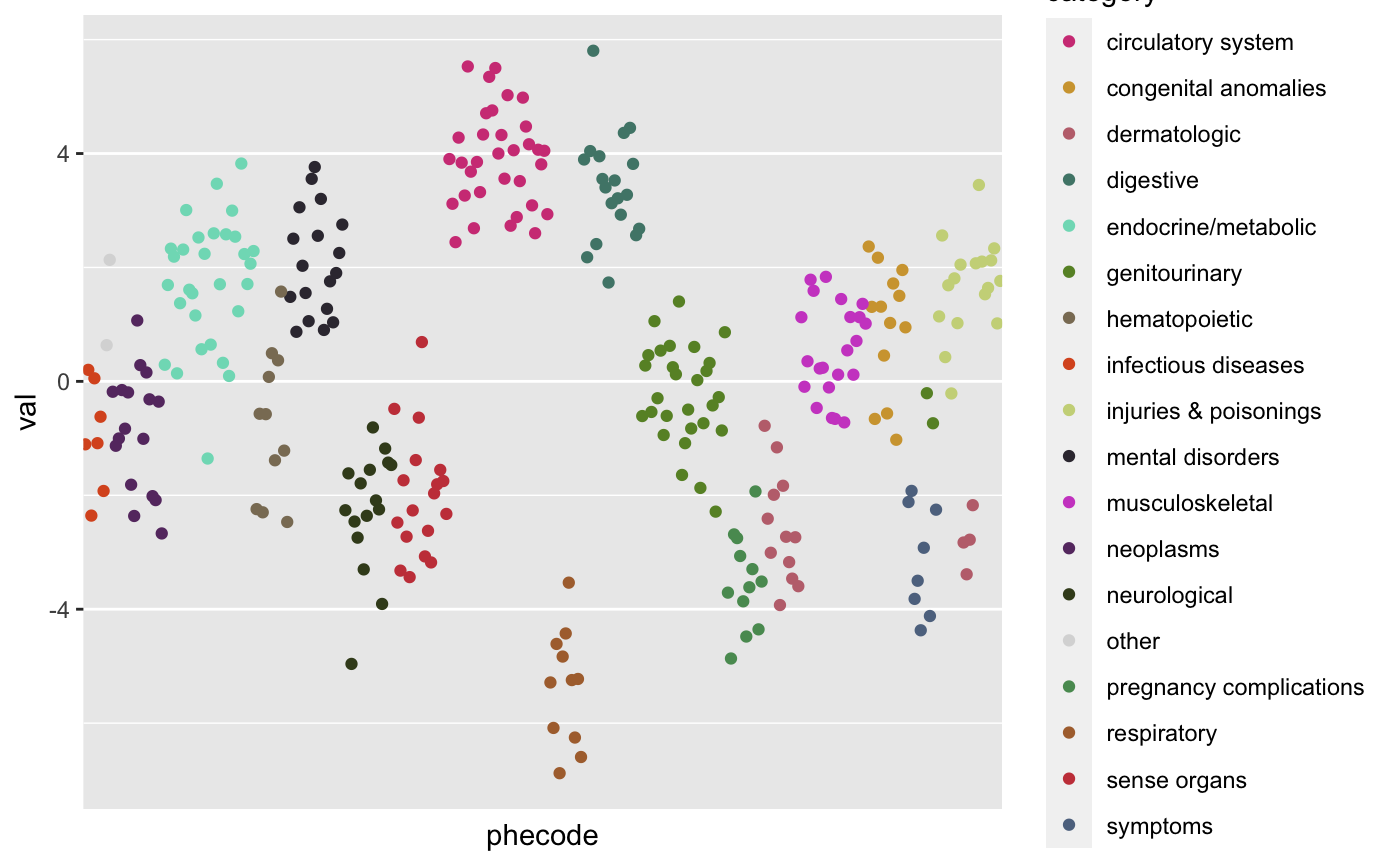
Turns off the plots attempt to write out each individual phecode name and ticks so plot renders faster and cleaner.
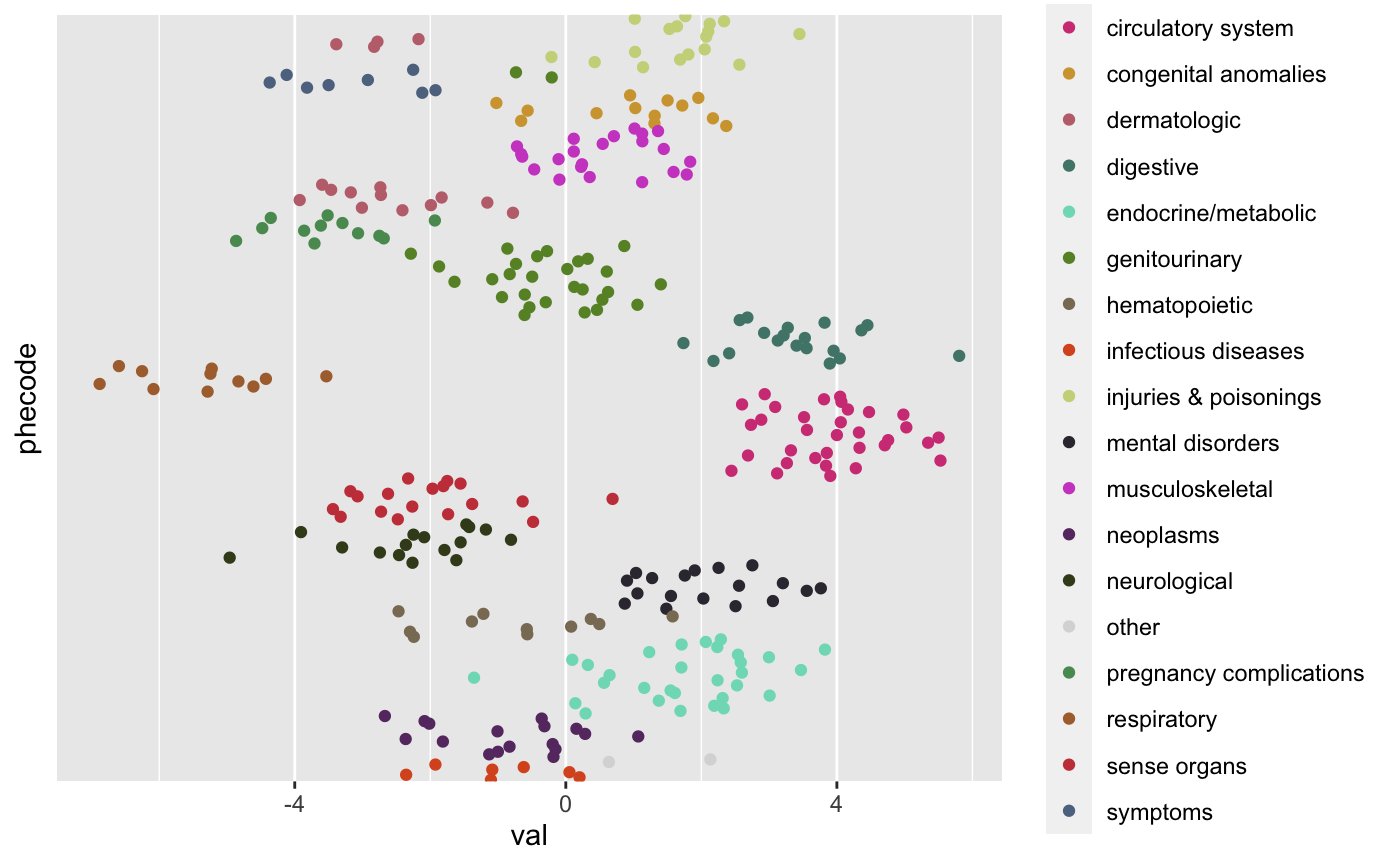
theme_phewas(phecode_on_x_axis = TRUE)
Arguments
| phecode_on_x_axis | Is the phecode in the plot on the x axis? |
|---|
Value
Ggplot2 theme object
Examples
library(dplyr) library(ggplot2) data <- sample_n(phecode_descriptions, 300) %>% left_join(category_colors(return_df = TRUE) %>% mutate(bias = rnorm(n(), sd = 3)), by = 'category') %>% mutate(val = rnorm(n(), mean = bias)) ggplot(data, aes(x = phecode, y = val, color = category)) + geom_point() + scale_color_phecode() + theme_phewas()ggplot(data, aes(y = phecode, x = val, color = category)) + geom_point() + scale_color_phecode() + theme_phewas(phecode_on_x_axis = FALSE)